We’ve already made a bunch of resources available to help you make a financial model “the old school way”, including a series of free templates available in our blog. But since doing it in excel is so much more complicated than what it should be, this time we’re going to show you how to do it with our new financial modelling tool.

Start your free trial.
No credit card required. Start building your model now 👇.
Why Chiefmetric?
So what is this tool for and what makes it different from using an excel template?
Chiefmetric is a software that automatically generates an Income Statement, Company Dashboard and calculates important Metrics and KPIs using only a few inputs submitted by the user.
This way, it offers a lot of benefits for the user when compared to the alternative of doing it from scratch on excel, or even based on a template/ example from another business. Below are only some of those benefits.
Error-proof
If you've ever used excel before, you know how difficult it can be to detect an error in a formula or input - even if you don’t hard code your formulas and follow the rule of “every input in a separate cell”, that sheet can quickly become messy (pun intended).
Adaptable to (almost) any business model
The story of this company starts with having founders as clients for business plans with the realization that the vast majority of a financial model can be productized, so you won’t have to battle with a pre-formatted excel template’s structure to adapt the model to your own.
- Yes, revenue streams vary a lot, but they’re either one-time purchases with more or less expected frequency, recurring fees, and little more.
- Of course a hiring plan is a very tailored part of any company, but you always have to consider social security costs, insurance, more or less limitation of sales/ position, etc.
- … and so on and so forth (we’re sure you get the idea).
The best part? Founders usually know all this input data already. They just don’t know how to organize it into financial projections.
For everyone. Really.
You don’t have to be an excel expert or financial connoisseur to use this tool. On the opposite, one of the reasons that inspired our founders to create Chiefmetric was to make financial projections as easy to do for everyone, as it is for all the “sophisticated MBAs” out there.
If you value your time, we’re sure you’re convinced by now, so let’s move on to show you how it’s done!
How to use Chiefmetric: the guide you won’t need
Most of our users have filled their company’s inputs in less than an hour, on their own, and didn’t have this article to guide their experience. For that reason, we sincerely doubt about the relevance of this content. Are you actually going to read this? Is it worth losing time explaining what’s so simple and obvious?
But we do know some people have to see it to believe it, so if you’re still reading this, we’ve written this article thinking of you!
[1/6] Complete your company profile
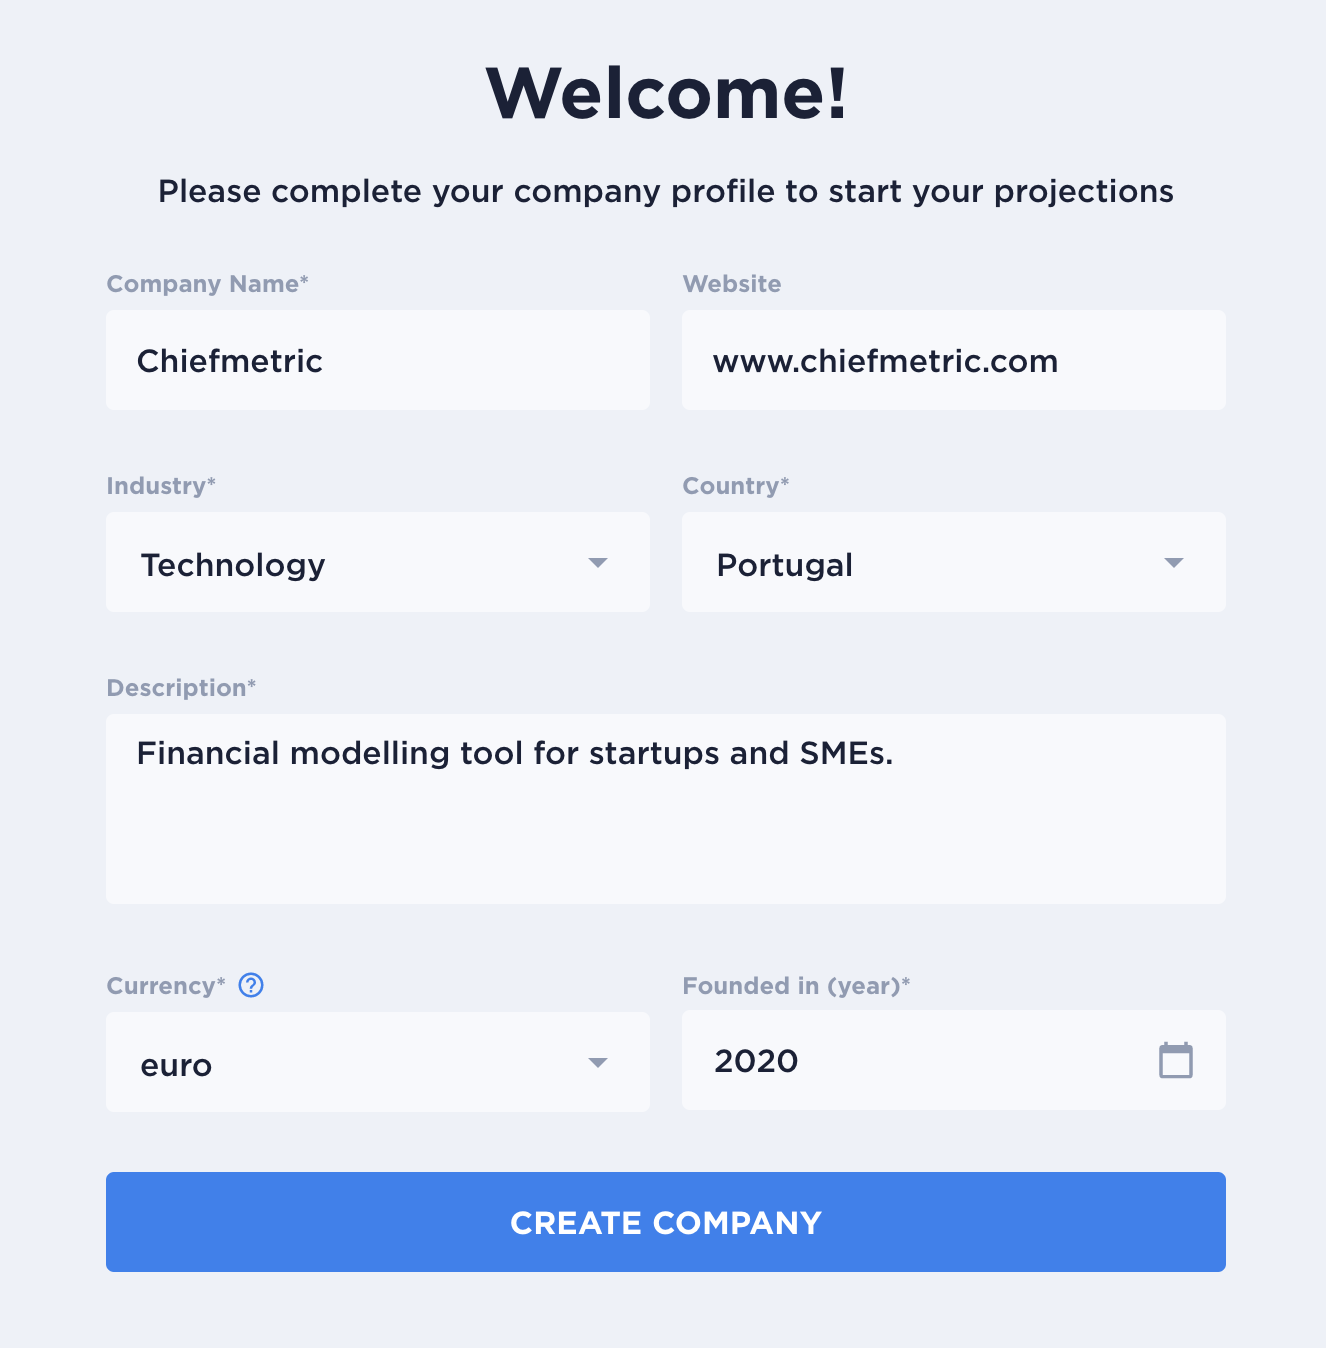
Ok, so, this part is really straightforward. The fields you see in the image are all related to things you should know (or at least we hope so): company name, website (if any), industry, country where it is based, a small description on what it does (so our team can offer you proper advice), the currency in which you want your projections done and the year the company was founded.
Congrats, your company profile is created! Now let’s start with the fun part.
[2/6] Create your first scenario (or as many as you want to)
Yup, at Chiefmetric you can create unlimited scenarios. Our team of founders has started other companies before, most of them funded by venture capital, and we know that when it comes to financial projections each of your scenarios will last, on average, a couple of hours. So we’re giving you the opportunity of creating unlimited scenarios without charging more for it.
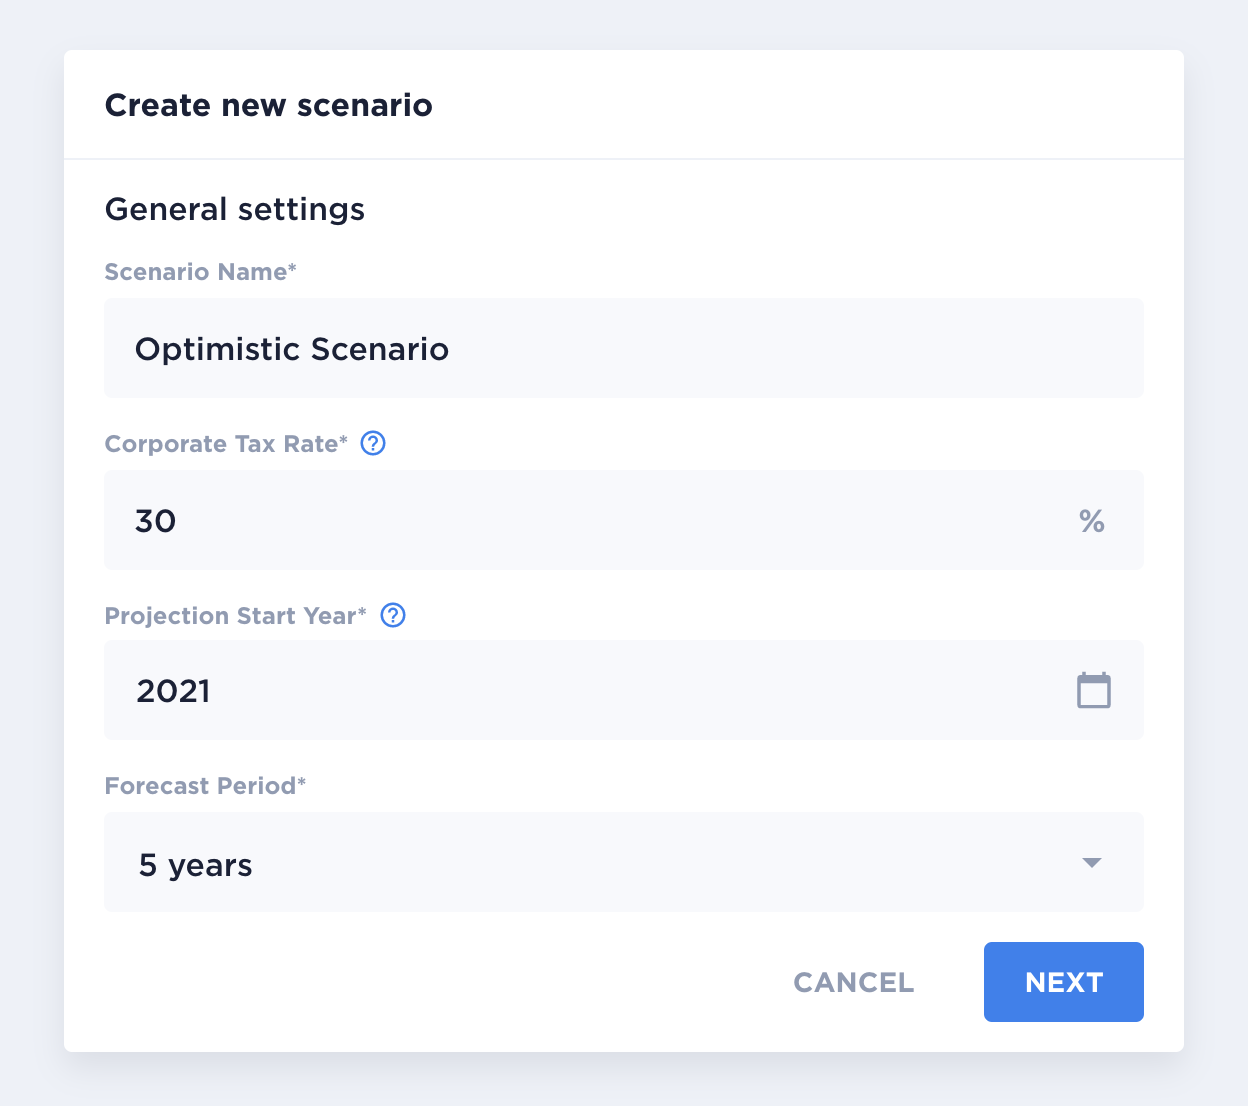
Just give each of your scenarios a name, the corporate tax rate to apply when you have profit, the year when you want those projections to start at and the forecast period you want to apply (3, 5 or 10 years).
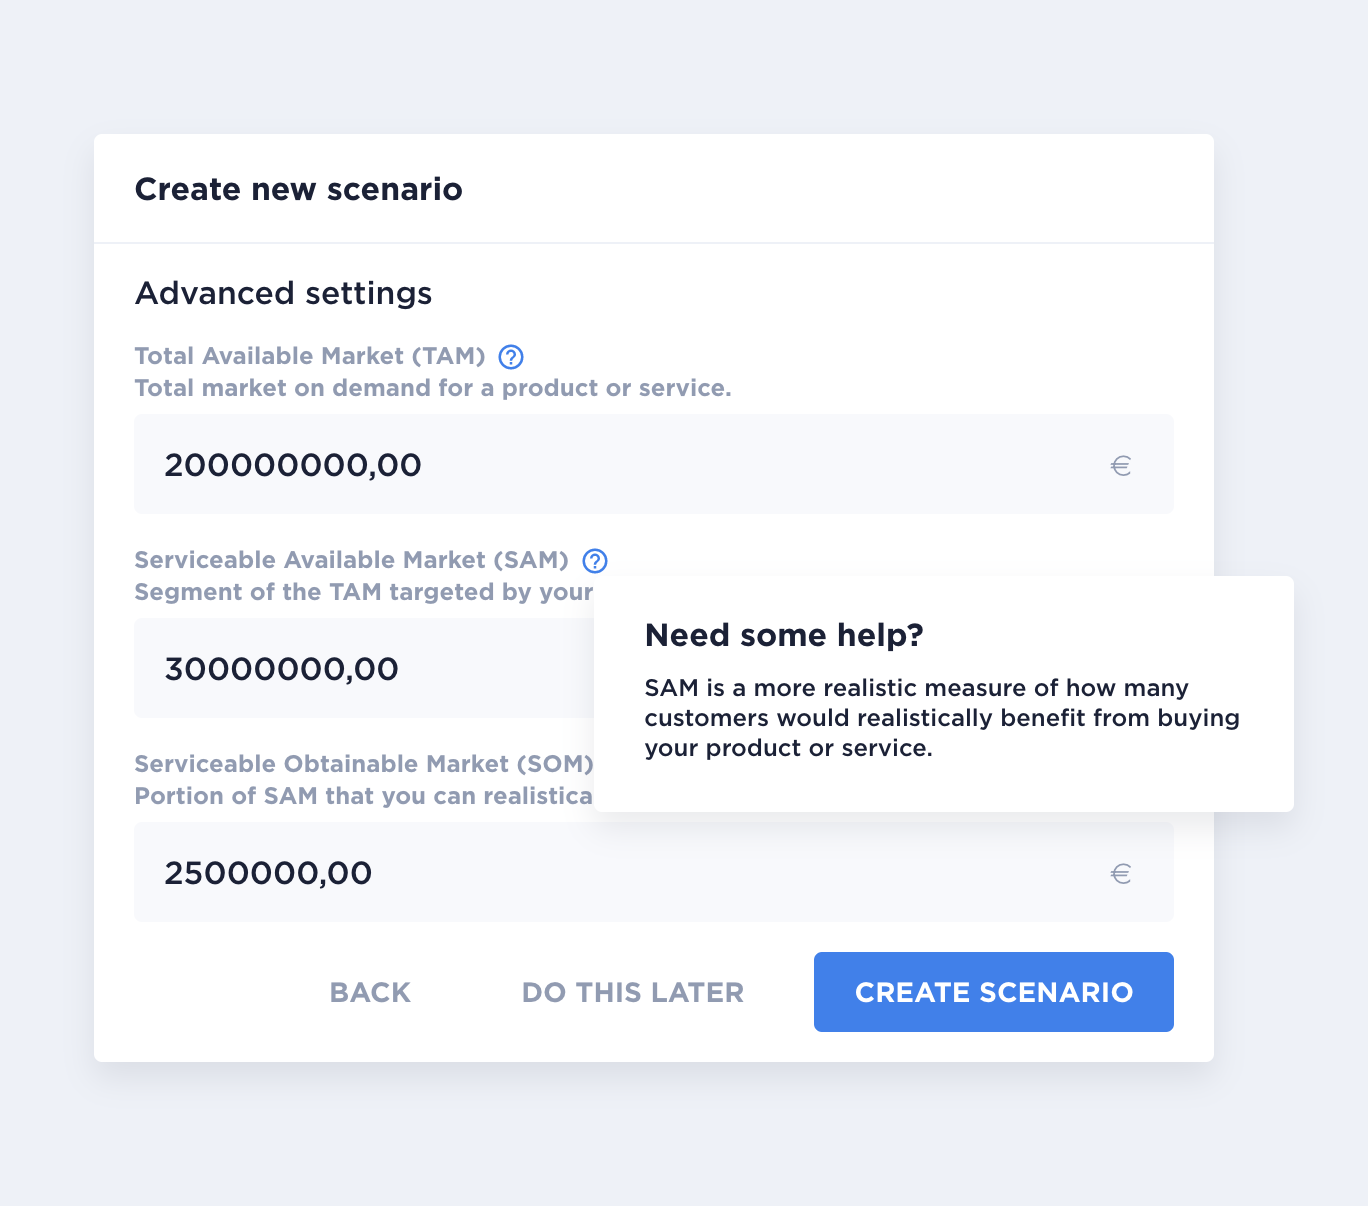
Optionally, you can also include your company’s market size, following the TAM / SAM / SOM methodology. This is especially useful to make sure your projections don’t count with more sales than what your market size allows you to. After filling all your revenue assumptions, our tool will automatically compare your total sales with this market size and showcase that market share in your Company Dashboard.
[3/6] Revenue Streams
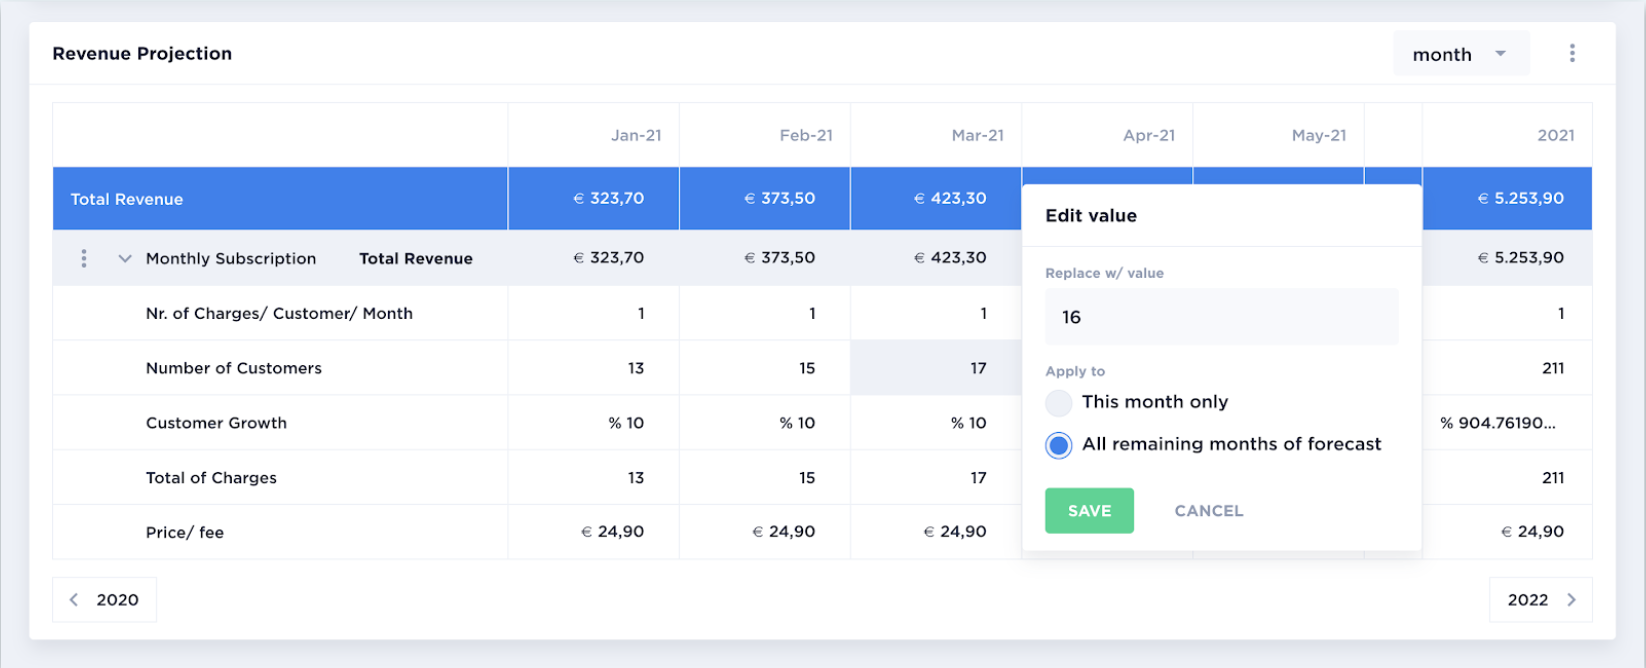
Starting with Revenue, every time you add a revenue stream, the below output table is updated.
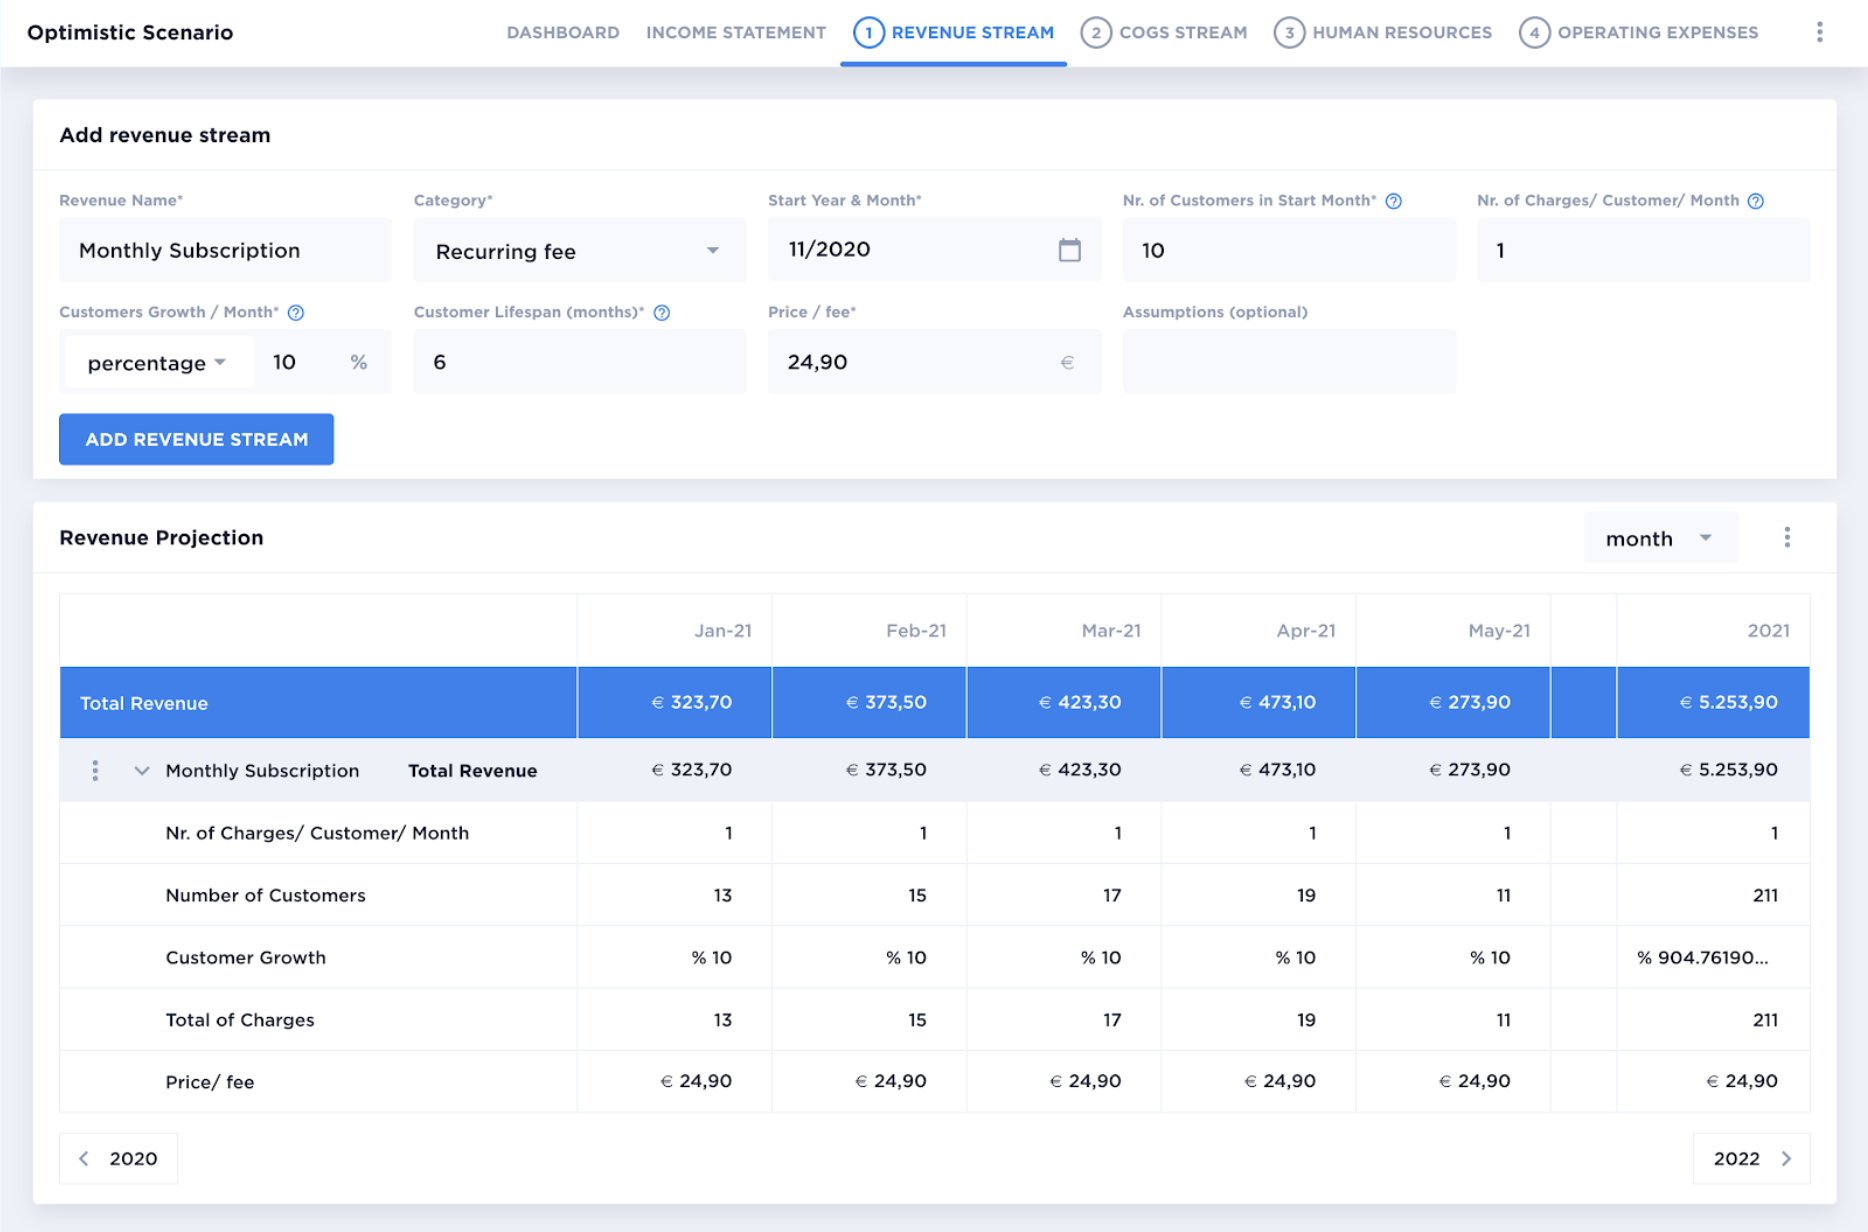
In all the input sections, you’ll be able to make changes directly in the output table. You can also change from monthly to yearly view.
[4/6] Cost of Goods Sold (COGS)
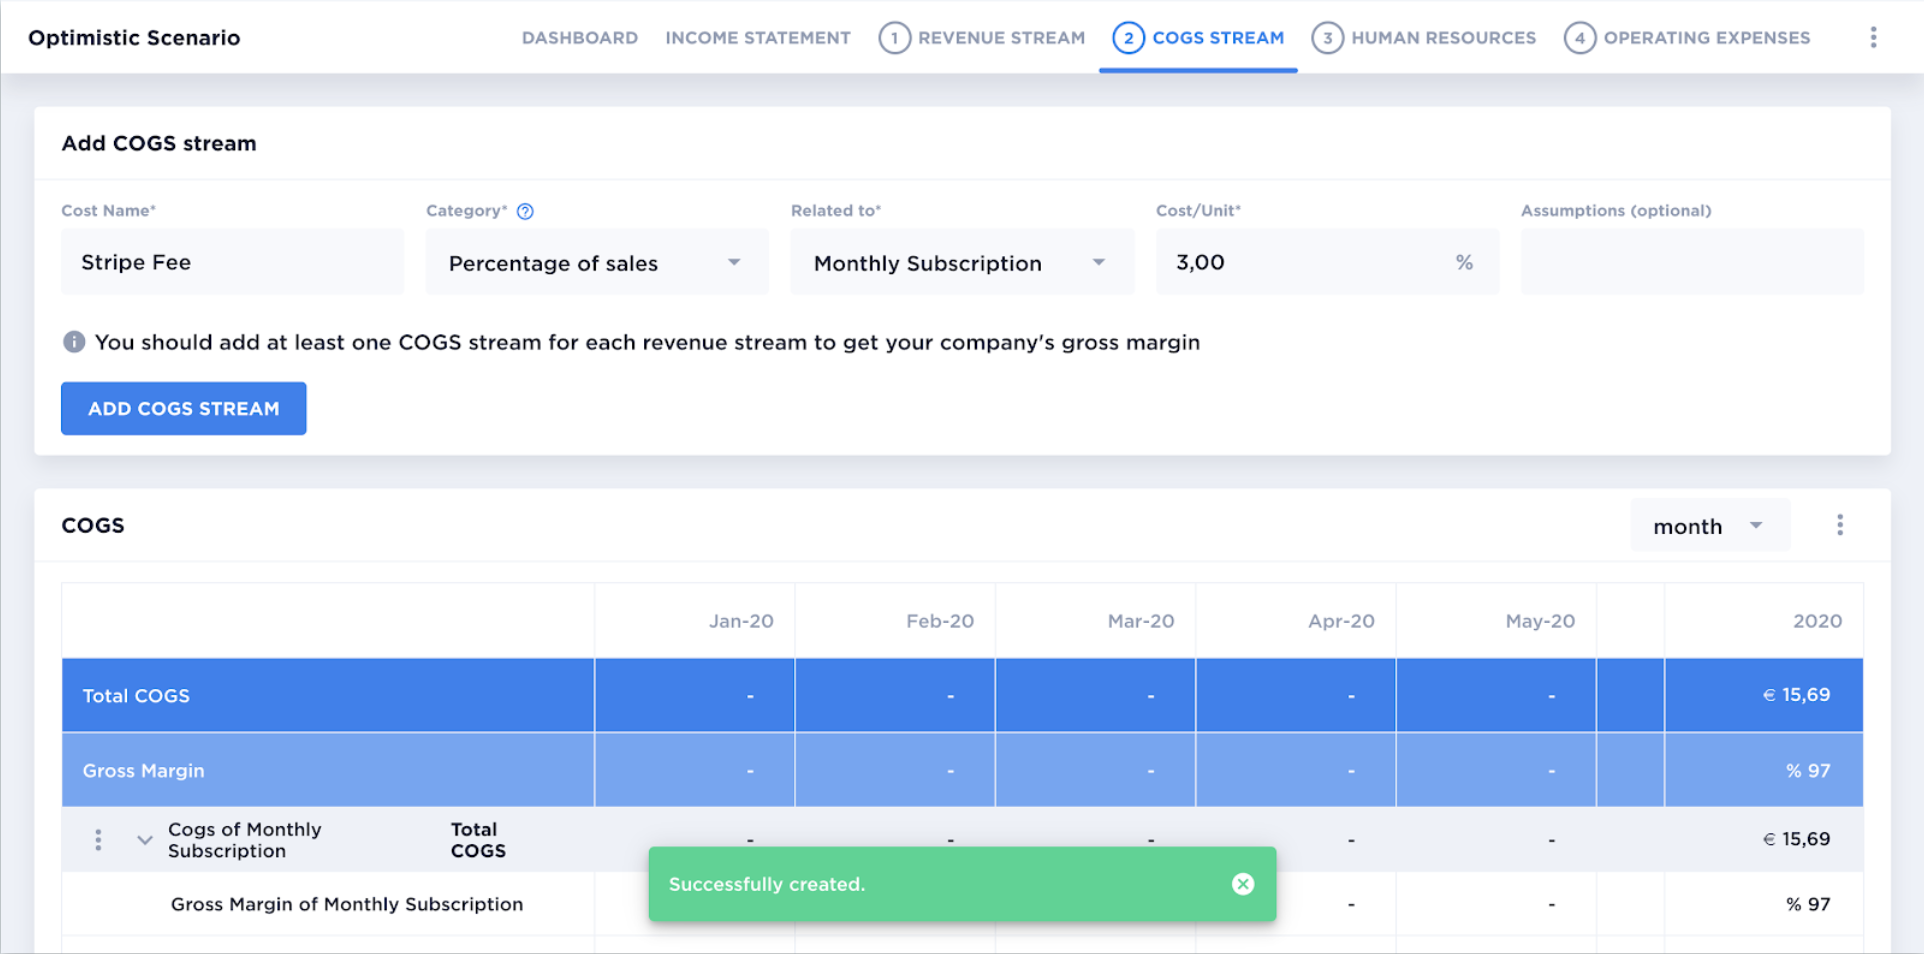
The process is very similar for all the other input sections. On this example of COGS, you can see a success message after adding an input.
[5/6] Personnel Expenses / Human Resources
To add personnel in the HR section is equally simple. The less straightforward fields have a question mark symbol (“?”) with tips, as presented in this image.

[6/6] Operating Expenses
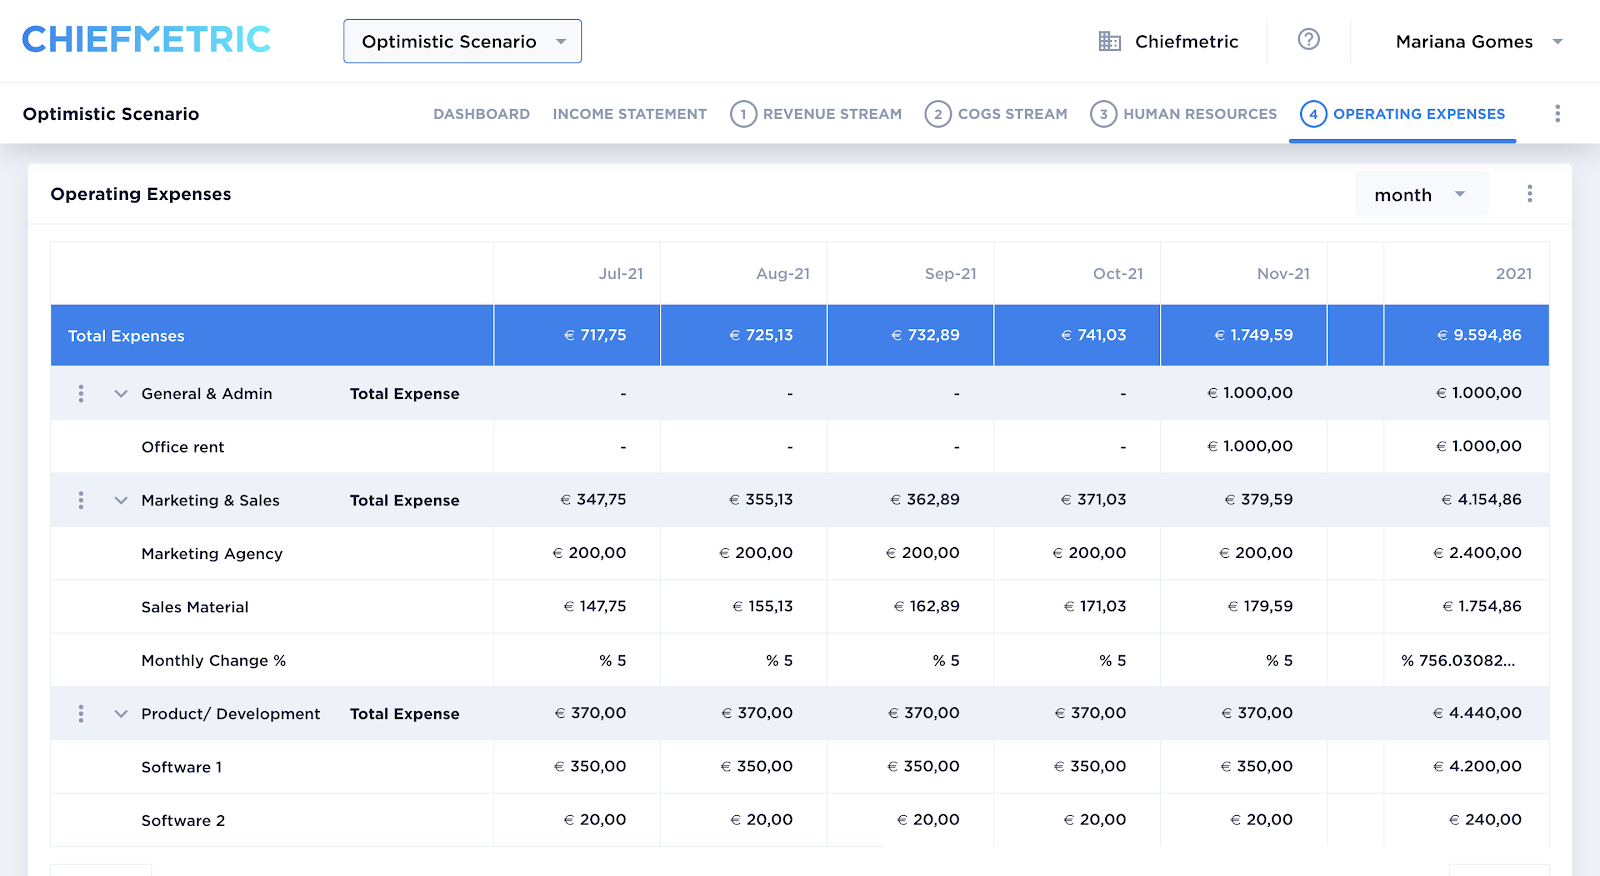
You can finally add your company’s operating expenses following the same flow as presented above for the other sections.
And tcharam! 🥳 Your financial model is done. But what exactly do you end up with?
Your Company Dashboard and Income Statement are ready
Ok, so you’ve done all this and now what? What’s in it for you? The answer is: two things that, in our opinion, speak better for themselves.
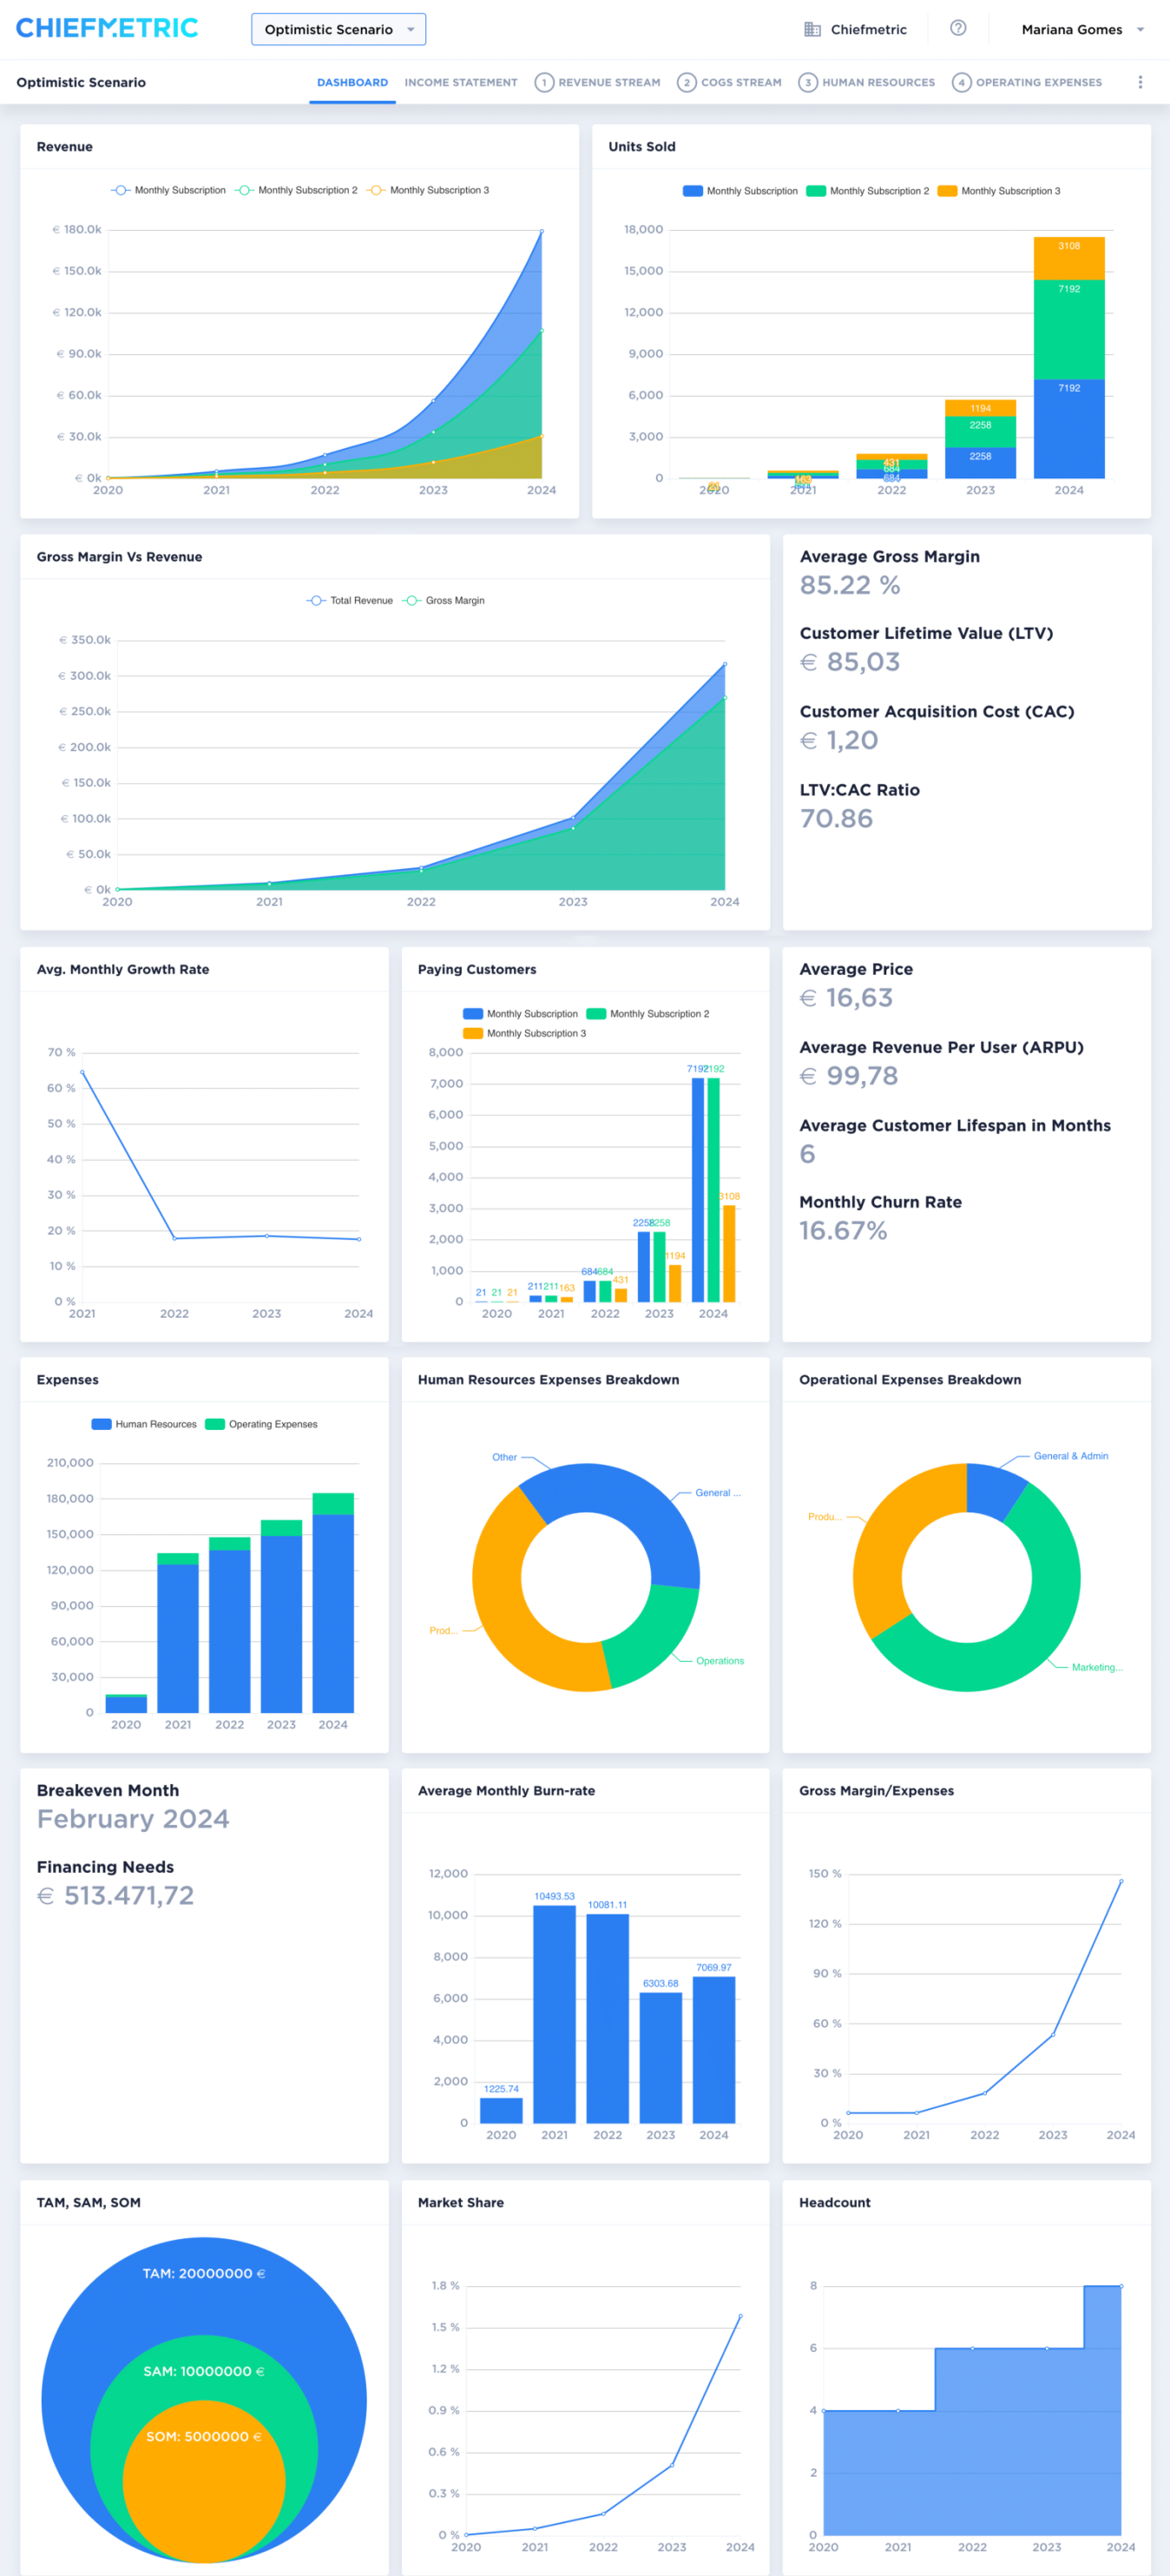
An amazingly complete Company Dashboard
Your numbers will look everything but boring by the time you've set up your business inputs. Ready to copy/paste on your deck.
Your company’s Projected Income Statement
Also known as Profit & Loss Statement, it will be automatically generated based on your inputs.
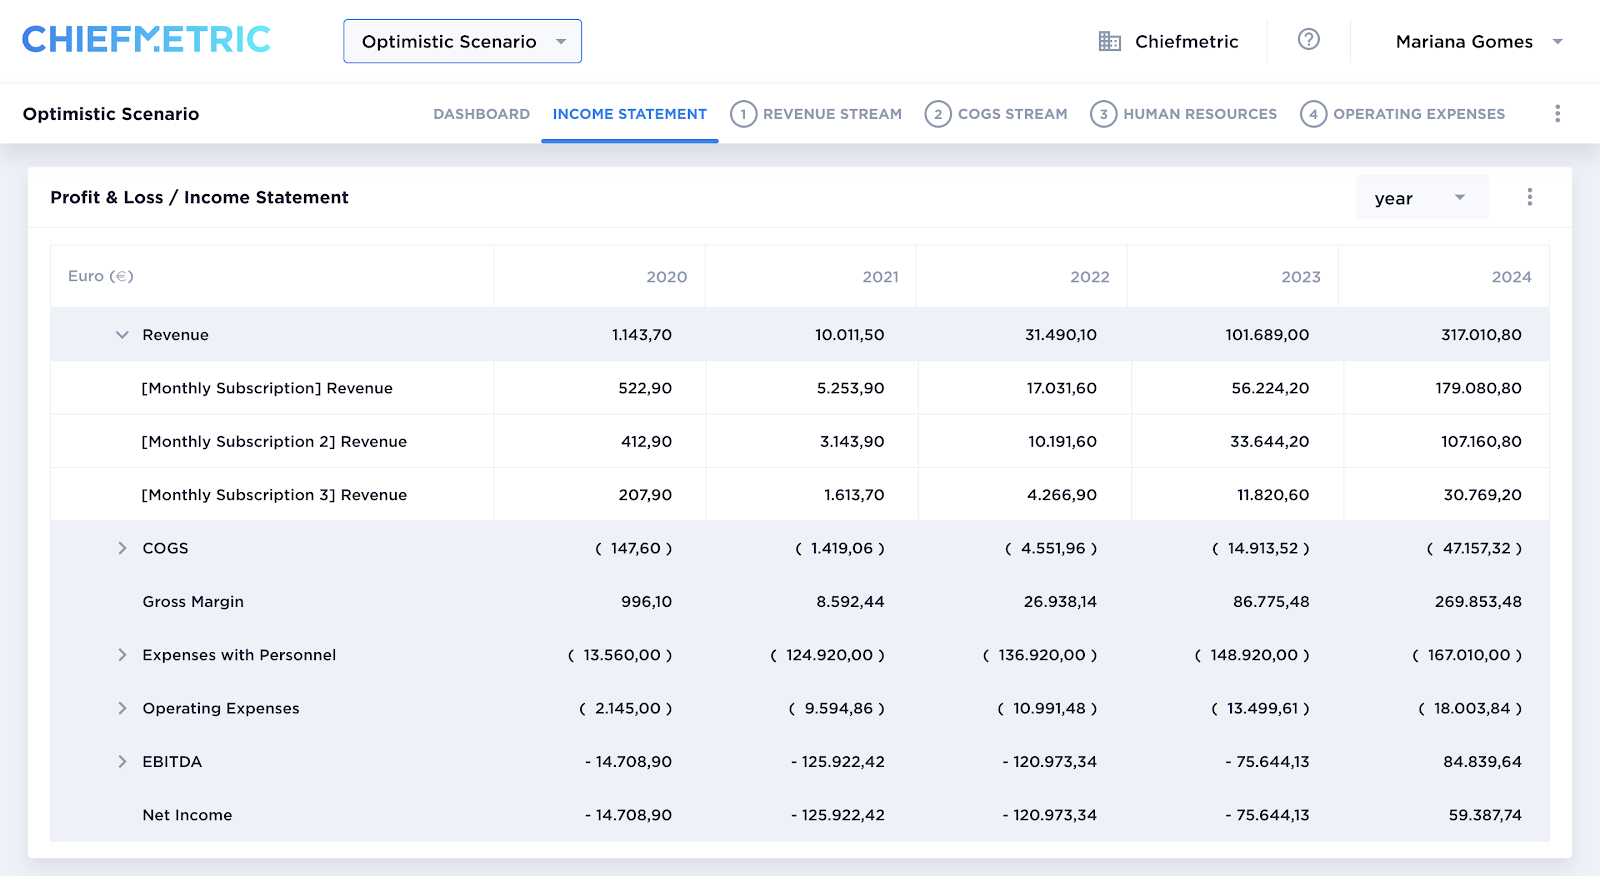
And yes, you can export all this to excel to facilitate sharing your projections with your investors/ shareholders/ whoever you want to.
Now, if we haven’t convinced you yet, then there’s nothing more we can say: you’re a true excel lover and there's nothing wrong with that!
But if you’re in doubt, we’re happy to help you make up your mind: just contact us at [email protected].


